FaMe-Net Methods
Explanation of the FaMe-Net methods and concepts, and information on content and use of the Morbidity Data web pages.
Scroll direct to content on this page:

Introduction to the FaMe-Net methods
This website provides primary care morbidity data from Family Medicine Network (FaMe-Net), a practice-based research network (PBRN) located in the Netherlands. FaMe-Net is the world’s oldest and still functioning PBRN. The network is a continuation of two well-known Dutch predecessor PBRNs from which it originated after their fusion in 2013: the Continuous Morbidity Registration Nijmegen (CMR) registering epidemiology since 1967, and the ‘Transition Project’, registering since 1985.(1)
FaMe-Net general practitioners (GPs) provide regular primary care to their listed patients. Registering for the PBRN occurs simultaneously and in the context of the Dutch healthcare system. The PBRN registration is performed for research and educational purposes.
FaMe-Net registers ‘complete’ morbidity, i.e. all morbidity that patients present to their GP. Data are collected continuously and longitudinally.
The participating GPs record morbidity (and other items) in their Electronic Health Record (EHR) named TransHIS, that was specially designed for the extensive data registration, facilitating education and research.
The data shown on this website are a selection of FaMe-Net’s most essential data. Concepts and terminology will be explained below. Data are extracted and periodically updated. The FaMe-Net registration is innovative, with ongoing evolvement, and contains more items than those shown on the website in the current version. As parallel processes, this website is continuously in development, with periodical addition of latest collected data, and with planned addition of more collected variables. We showed the innovations and the expansion of the FaMe-Net registration from 2016 onwards in a paper.(1)
Click here for more information on the network FaMe-Net, its historic background, the Dutch health care system, participating practices, and scientific output.
Data from the FaMe-Net database are available since 2005. Since then, all data within FaMe-Net have been uniformly classified according to ICPC-2.
The fusion in 2013 resulted in a significant expansion of the study population with an altered age distribution: relatively more younger patients joined resulting in a smaller proportion of the 75+ group. This has an impact on the incidence and prevalence of morbidity. This is why data on this website are presented from 2014 onwards.
Currently, data have been updated up to and including 2021, derived from six family practices (35 GPs). In these practices, more than 41.000 patients were registered at the end of 2021.
The network and the registering practices are stable. Registering practices may sometimes join or leave the network.
The latest update of the website has been performed in February 2023.
FaMe-Net has been shown to provide high-quality data derived from an unselected population.
FaMe-Net performs systematic quality checks of the stored data and provides registration feedback to GPs, e.g. in the registration of malignancies and deaths. Uniformity in registration of diagnoses, RFEs and interventions is achieved through continuous training and quality control programs for GPs (in training), practice assistants and practice nurses (POHs).
The patient population in FaMe-Net is representative of the general Dutch population.(2)
Since 2016, FaMe-Net has started to collect contextual and personal characteristics of all the listed adult patients in a structured way. Addition to the website of some variables collected in this way is planned.
Click here for more information on collected data in FaMe-Net.


Concepts used in FaMe-Net
Below we describe the most important concepts used in FaMe-Net and how they are applied.
The core concept within FaMe-Net is the Episode of Care (EoC): all data in FaMe-Net are ordered into Episodes of Care. It can be defined as ‘a health problem presented by an individual to a healthcare provider, from the first presentation until the last encounter’. EoCs have a title, the episode diagnosis, classified with ICPC-2. The episode diagnosis can be modified during the EoC. An example: an EoC is first labelled as fatigue, but the diagnosis (episode title) is changed to iron deficiency anaemia, and it later appears to be caused by colon cancer, which will be the final diagnostic label. All contact elements related to this health problem are comprised in this EoC, including specialist reports to the GP.
Presented data from ‘Episodes of Care’ are abbreviated to ‘Episodes’ on this website.
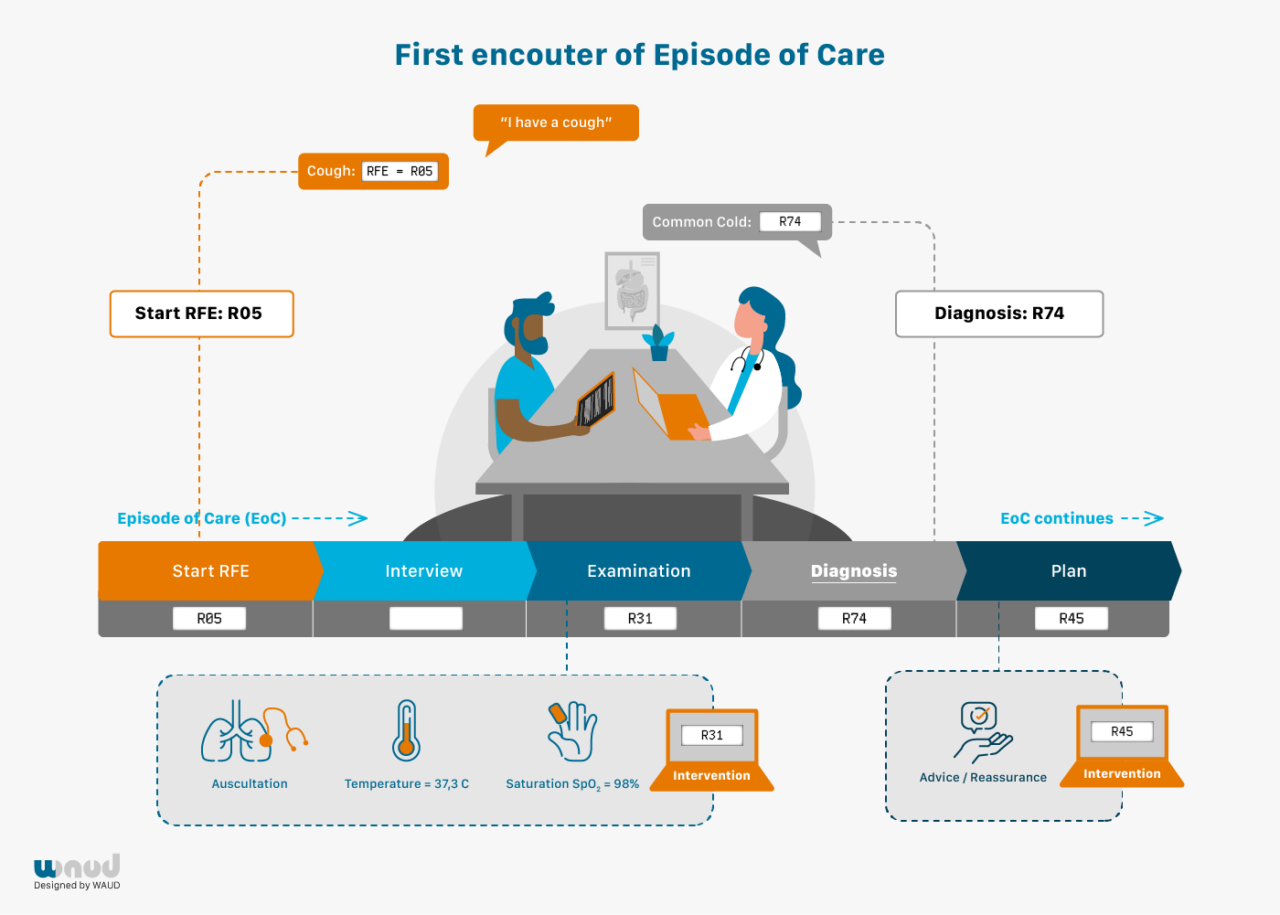
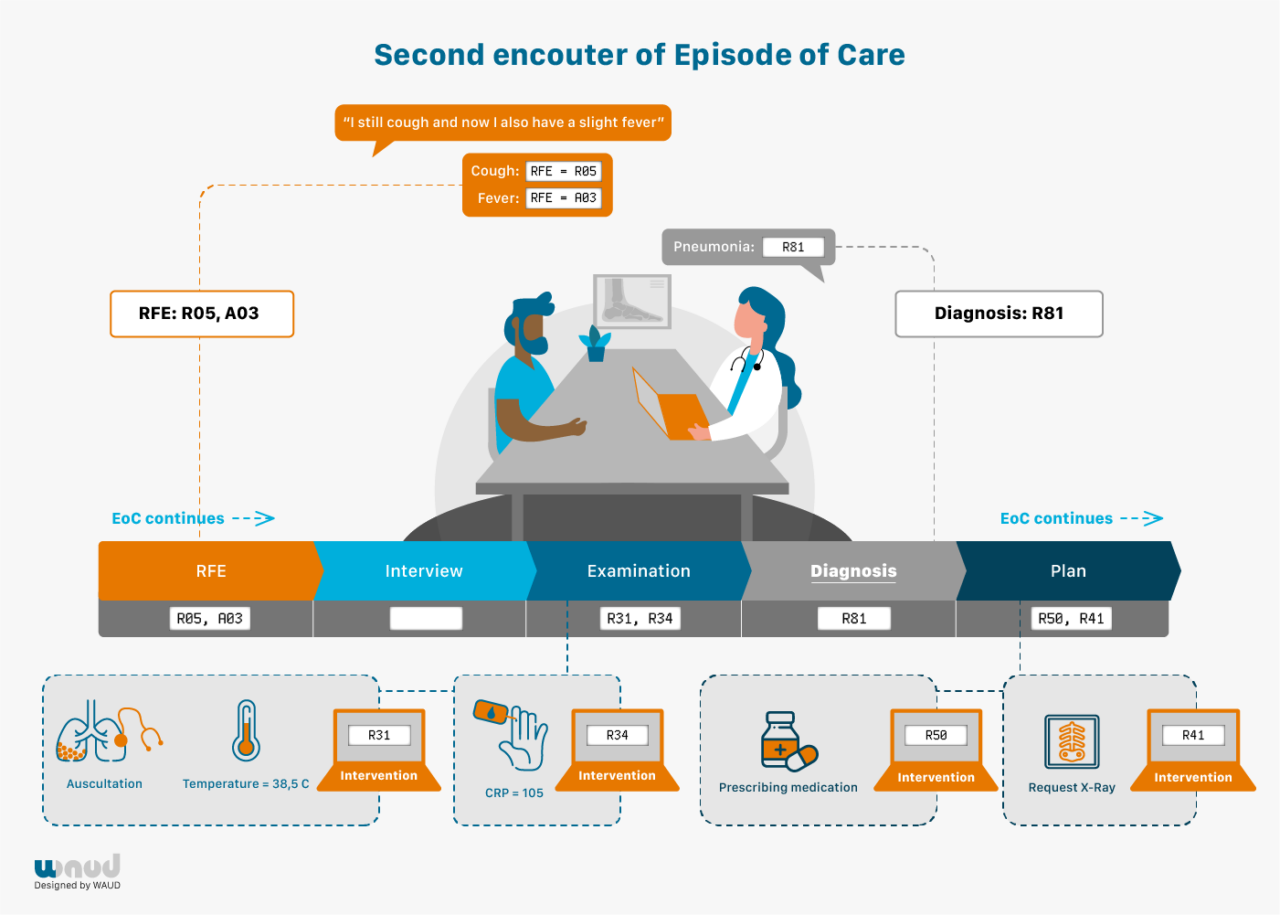
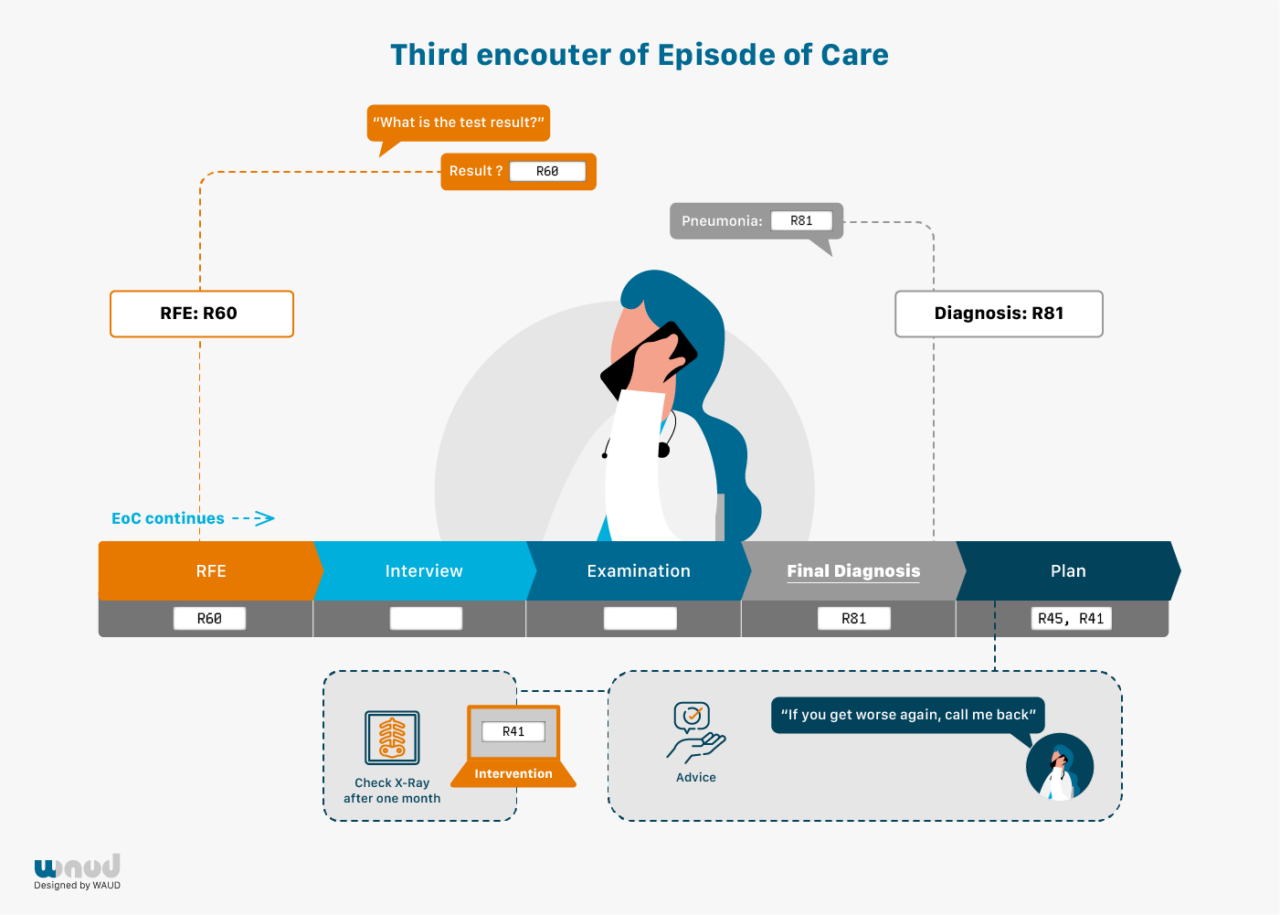
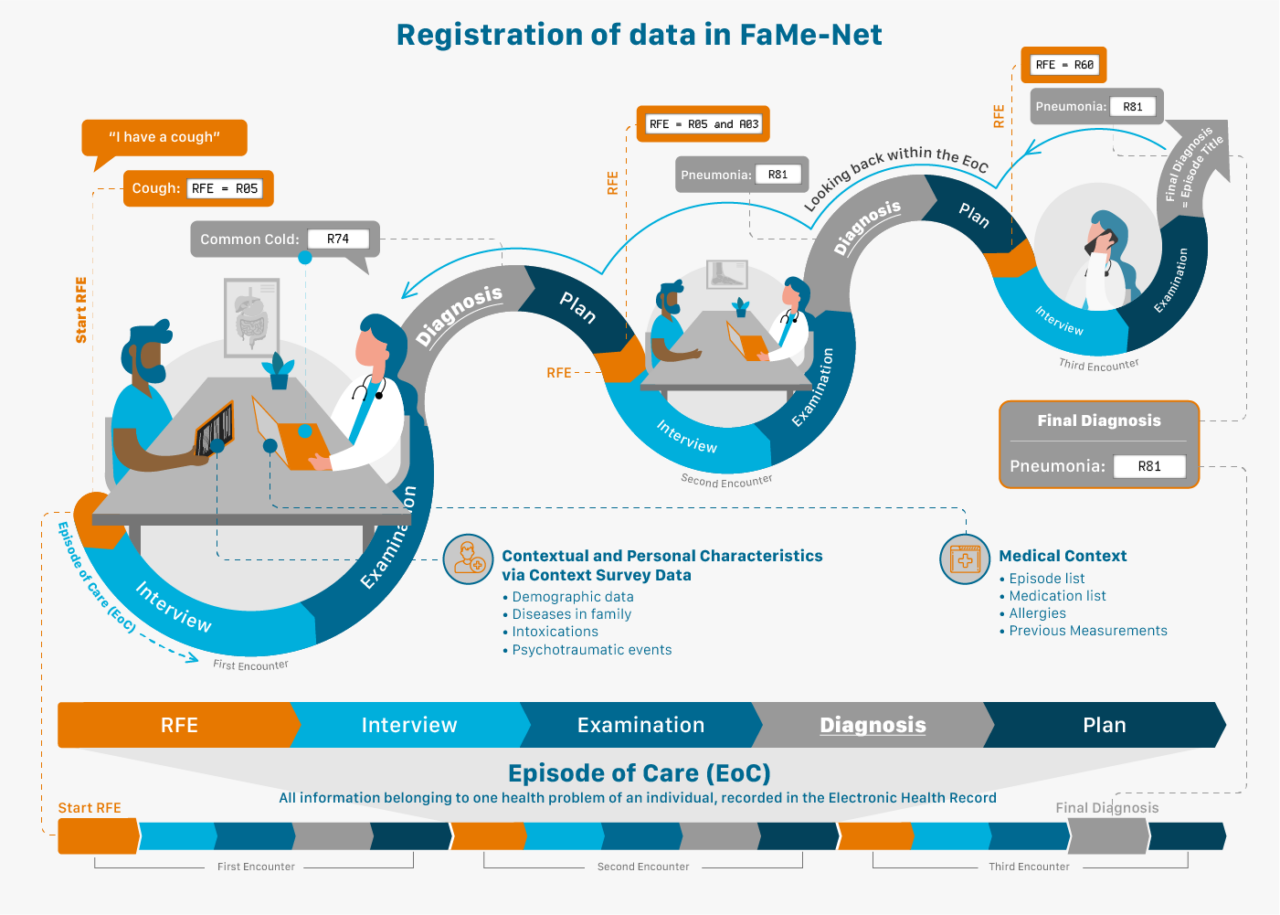
Another essential concept used in FaMe-Net is the Reason for Encounter (RFE).
Patients normally start the consultation with a spontaneous statement on why they visit the doctor: the Reason For Encounter. This reflects the initial presentation of the illness. This statement precedes the interaction between patient and GP, and the GP’s interpretation. RFEs are recorded regardless of the final diagnosis. FaMe-Net routinely and systematically registers all RFEs in all encounters during regular consultations, taking GPs less than a minute of time.
The RFE(s) can be presented as a symptom (e.g. abdominal pain, a rash, cough), but also as a self-diagnosed disease (‘I’ve got the flu’; ‘I think I have migraine’; ‘I hope it’s not pneumonia again’) or a request for a particular intervention (‘I would like to have a blood test’). When multiple RFEs are presented, all are registered. The RFE(s) should be recognised by the patient as an acceptable description of the demand for care. RFE registration enables research studying associations between RFE and (final) diagnosis. RFEs in themselves have important prognostic value, for example in diagnosing cancer. (3, 4)
All presented symptoms, complaints, diseases, and problems in FaMe-Net are classified by the GP in accordance with the International Classification of Primary Care (ICPC-2) at the highest level of accuracy and understanding. In addition to ICPC-2, diagnoses are also coded with the International Classification of Diseases and Related Health Problems (ICD-10).
Transfer to ICPC version 3 is planned, now that it has been released in December 2020. This will allow for additional recording of functioning (activities and participation) and personal preferences linked to morbidity.
All interventions and processes are also coded with ICPC-2. These include referral to primary or secondary care professionals, diagnostic imaging, laboratory testing, and therapeutic interventions such as medication, vaccination or surgical procedure.
Prescriptions are coded according to the Anatomical Therapeutic Chemical (ATC) coding system maintained by the World Health Organization.5
Prescription data provide detail and are a particularisation of the intervention type ‘medication’ (ICPC-2 code *50).
Prescription data are shown by the first five characters of the ATC code by default. If desired this may be changed to a less detailed level with the first four characters of the ATC code so that prescriptions are studied in larger groups of medication. This can be changed in the report showing Relations between a chosen episode (ICPC code) and its percentage with a prescription.
FaMe-Net distinguishes referrals to primary care professionals and to secondary (specialist) care, and the specialisms among these referral types (primary or secondary).
Referral data are a particularisation of the intervention type ‘referral primary care’ (ICPC-2 code *66) and ‘referral secondary care’ (ICPC-2 code *67).
Synonym: contact, consultation.
An encounter is the professional interchange between a patient and a GP. Healthcare provided to patients by other team members of the general practice (practice assistants, practice nurses (Dutch: POH’s), GPs and doctors (in training) are also recorded in encounters.
We distinguish different types of encounters (encounter types). The majority concerns consultations during office hours. Other encounter types distinguished are home visits, telephone and email consultations (by the GP or the practice assistant), out-of-hours consultations, repeat prescriptions and administrative contacts (specialist letters). They all contribute to the registered morbidity, ordered in EoCs.
One or more Episodes of Care may be dealt with at an encounter. When more than one episode is dealt with during an encounter, there are two or more sub-encounters.Every (sub)encounter has at least one RFE. The only exemption are reports (letters) from other healthcare professionals, which do not have an RFE recorded.
Every encounter results in an (initial) diagnostic label, which is named Encounter diagnosis in FaMe-Net. This Encounter diagnosis may or may not be the final diagnosis (EoC). An Encounter diagnosis could be tiredness, changing later in the Episode to iron deficiency anaemia, and still later to colon cancer. In FaMe-Net’s Episode registration, all these encounters contribute to the Episode (EoC) colon cancer, but we are still able to review the (temporal/preliminary) Encounter diagnoses. In general practice, many Episodes of Care consist of only one encounter.


Epidemiologic concepts: Prevalence and incidence
Prevalence
Definition and methods
‘Prevalence’ expresses the proportion of a defined population with a specific health problem in a defined period of time. FaMe-Net uses periods of one calendar year and reports a ‘contact prevalence proportion’. This figure represents the proportion of the population that had at least one interference with the GP (e.g., consultation, prescription) for a selected episode (i.e. final diagnosis). This is calculated by dividing the number of persons contacting their GP for a specific health problem during the selected calendar year(s), by the total number of patients in these years. More precisely, the denominator ‘patient years’ combines the number of listed patients in a practice with the length of their registration. This corrects for the dynamic population in a general practice in which patients are born, die, and move in or out of the practice.
Thus, in the methods applied in FaMe-Net, some interference with the GP (practice) is needed in order to be included in the prevalence (‘contact prevalence proportion’) or incidence figures (see below). This method makes these data particularly good for an assessment of the epidemiological representation of illness and conditions under the treatment or surveillance of the GP. For diseases and conditions with a variable course, such as depression, gout, or allergic rhinitis, these methods reflect whether or not the disease is still severe enough to seek medical help. Consequently, medical problems not reported to the GP, e.g. minor problems for which no professional medical help is sought, are not included in these figures. Moreover, a severe disease that is exclusively handled by a specialist (e.g. HIV/AIDS) is also potentially underreported. This effect is probably limited as in most cases the GP receives (yearly) written reports on the situation, or is involved in prescribing medication or monitoring, for example by requesting lab tests.
For assessment of prevalence, the episode label that was recorded at the end of the calendar year is used. For episodes evolving over a longer period of time, and in episodes in which the final diagnosis is harder to make, it should be noted that this might result in some underestimation of the rate of these more severe diagnoses in the first year(s) that this condition is recorded. The Distributions tab page presents prevalence data of episodes.
Trends in prevalence
Prevalence figures fluctuate over years. The extent of this year-to-year fluctuation depends on the specific condition. To make optimal use of the complete data collection, FaMe-Net calculates and displays prevalence numbers over all calendar years in the dataset. Prevalence numbers of single calendar years are summed up and divided by the number of calendar years to calculate the mean prevalence over the entire data period.
All age and sex groups are included in these figures.
The website user may adjust the calendar years if prevalence numbers are sought only for a selection of the entire period (‘Apply a selection of calendar years’).
Data from before 2014 are available upon request by filling in an application form.
Trend chart
In order to visualise the direction of changes in prevalence or incidence (see below) over time, charts are presented. Coincidental fluctuations are levelled by using a technique of ‘rolling three years average’, summing up the values for the actual year, its preceding year and its following year and then divide it by three. This emphasises the direction in which changes in prevalence or incidence stretch over years without underlining occasional outliers.
The trend chart always shows data for the entire calendar period included in the dataset and remains unchanged, even when a shorter selection of calendar years is applied by the user (‘Apply a selection of calendar years’). The first and last year of the included dataset are not shown in the chart, because for these years the rolling average cannot be calculated as it requires data from the preceding and following year.
The trend charts are presented on the Distributions tab page.
Incidence
Definition and methods
‘Incidence’ expresses the rate of occurrence of new diagnoses of a specified health problem in a defined population during a defined time period. FaMe-Net uses periods of one calendar year and reports the ‘incidence proportion’. This counts all newly occurring (starting) episodes of a certain condition during a calendar year, and divides it by the total amount of patient years. Cases (new episodes) are counted and not persons with the diagnosis. It is up to the clinical judgment of the FaMe-Net GP whether the encounter is a continuation of an existing episode or the start of a new episode.
All patient years are counted in the denominator of the ‘incidence proportion’, not ‘patient years at risk’ (which would be used in an ‘incidence rate’).
For assessment of the incidence, the episode label that was recorded at the end of the calendar year is used. For episodes evolving over a longer period of time, and in episodes in which the final diagnosis is harder to make, it should be noted that this might result in some underestimation of the rate of more severe diagnoses.
The Distributions tab page presents incidence data of episodes.
Trends in incidence
FaMe-Net calculates and displays incidence numbers over all calendar years in the dataset. Incidence numbers of single calendar years are summed up and divided by the number of calendar years to calculate the mean incidence over the entire data period.
All age and sex groups are included in these figures.
See also Trends in prevalence.
Trend chart
Trend charts visualise the direction of changes in incidence over multiple years, depicting ‘rolling three years averages’.


Content and use of this website
This website provides statistical and epidemiologic data from the FaMe-Net registration. The three following tab pages show different content and are labelled ‘Distributions by age and sex’, ‘Top lists’ and ‘Relations’. Data are extracted as datasets of entire calendar years and are periodically updated. Users of this website may choose to display data only from a subset of the calendar years presented. A fourth tab page presents clinical ‘Chapters’ containing data from the other three tab pages concerning a specific disease or condition.
The tab page ‘Distributions by age and sex’ provides information about (all) Episodes and RFEs and their distribution among different age and sex categories. In addition, the age and sex distribution of (all) interventions and referrals and (all) encounter types is shown here. For all variables shown, the website user may choose to display only a specific ICPC code of an Episode, RFE, or Intervention, only a specific specialism for Referral, or only one or more specific encounter types, and their sex-age distribution. Data are expressed per 1000 patient years. Some variables may be presented in absolute numbers if desired. Finally, the tab page ‘Distributions’ shows the contributing number of patient years in this dataset and the distribution of patient years among different sex and age groups.
The tab page ‘Top lists’ shows the most common diagnoses (Episodes and Encounter diagnoses), Reasons For Encounter (RFEs), referrals, prescriptions and (other) interventions.
The tab page ‘Relations between Episodes, RFEs and Interventions’ (abbreviated ‘Relations’) shows relations between Episodes, RFEs and Interventions. Two specific interventions can be shown in detail: Prescriptions and Referrals (to primary and to secondary care).
This function can be used for information about the relatedness between Episodes and RFEs of special interest (for example, when pneumonia, breast cancer or infectious conjunctivitis is the final diagnosis, which are commonly presented RFEs?); or to see the final outcomes (Episodes) of a specific RFE (for example, which are common final diagnoses when patients present with (RFE) tiredness, dizziness, cough?). Other relations are also provided with this tab page. For example, data on interventions, prescriptions and referrals according to an Episode of interest. But also, following an RFE of interest (e.g. abdominal pain, vaginal discharge), interventions and referrals can be shown, regardless of the final diagnosis (Episode). This gives insight in results (outcomes) following the entrance that patients provide themselves: the RFE. This adds the patient’s perspective to the traditional ‘doctor’ or ‘diagnosis driven’ perspective in epidemiologic data. Finally, this tab page provides information following a specific intervention (e.g. diagnostic imaging (*41), blood testing (*34) or immunisation (*44)) on the corresponding common final diagnoses (Episodes) or RFEs upon initial presentation.
The tab page ‘Chapters’ presents multiple chapters, each presenting a clinical condition or cluster of symptoms in textbook style. It starts with a description of the clinical course of this condition, next an outline of how the condition is recorded in FaMe-Net, followed by the epidemiologic figures (incidence and prevalence) from the website. Next, each chapter describes how the condition is generally presented in the first encounter, based on the Reasons for Encounter (RFEs). Finally, the chapters describe GPs actions related to this condition, based on interventions performed in all episodes of care. The chapters contain clickable links to data on the website. By reading chapters, the website visitor is guided through several locations on the website containing relevant information concerning this condition. This may help to get familiarised with the possibilities of this data website. Moreover, the text may help in the interpretation of the data and the identification of possible pitfalls.
Reference list:
1 Luijks H, van Boven K, Olde Hartman T, Uijen A, van Weel C, Schers H. Purposeful Incorporation of Patient Narratives in the Medical Record in the Netherlands. J Am Board Fam Med 2021; 34: 709-23.
2 Statistics Netherlands (CBS). [updated 12-12-2019; cited 2020 18 May 2020]; Available from: https://www.cbs.nl/en-gb/figures/detail/37296eng.
3 De Jongh T, De Vries H, Grundmeijer H. Diagnostiek van alledaagse klachten. Bouwstenen voor rationeel probleemoplossen. Houten: Bohn Stafleu van Loghum; 2004.
4 Van Boven K, Uijen AA, van de Wiel N, Oskam SK, Schers HJ, Assendelft WJJ. The Diagnostic Value of the Patient’s Reason for Encounter for Diagnosing Cancer in Primary Care. J Am Board Fam Med 2017; 30: 806-12.
5 World Health Organization. ATC/DDD Index 2021. Oslo [31 May 2021]; Available from: https://www.whocc.no/atc_ddd_index/.
